In general, I am quite good at maintaining my WordPress websites. I use the fantastic update service WP Remote to ensure all plugins and themes are kept up to date and I regularly remove plugins that I am not using.
However, I am only human.
From time to time some things do slip through the net and I don’t realise I have missed anything until much later.
When I started getting automatic disk warning emails from my server telling me that this blog was using most of its allocated block, I knew something was wrong.
The Investigation Begins
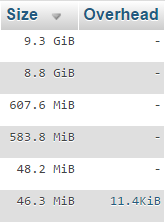
I began looking into where the storage was being used up and saw that phpMyAdmin was reporting that this blog’s database is 19.5GB in size. When I sorted the database by row size I started to get a better picture of what was happening.

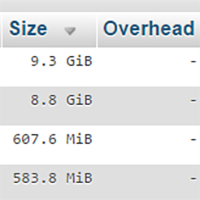
The top four rows all had profiler in the name. The profiler_functions table was taking up 9.3GB, profiler_queries was taking up 8.8GB, profiler_requests was taking up 607.6MB, and profiler_plugins was taking up 583.8MB.
To put into perspective how large these tables are, you need to look at the next tables. The next largest table is the prli_clicks table created by the link tracker Pretty Links Lite. After that I have the posts table with 46.3MB.

The profiler tables that were taking up a ridiculous amount of space in my website database were generated by a WordPress plugin called Performance Profiler. Retailing at only $9, the performance profiler plugin can be used to detect which plugins are slowing down your website and adding a lot of overheard.
In this instance it was Performance Profiler itself that was causing the overhead.
Unnecessary Overhead
Profiling plugins such as Performance Profiler and P3 Plugin Performance Profiler are useful for determining which plugins are causing slowdown and CPU bottlenecks, but they put a lot of strain on your server. This is why it is best to install these types of plugins, test everything, and then remove them.
I had failed to remove Performance Profiler and over time it had used an obscene amount of space in my database. It is pretty poor that a database optimisation plugin could cause this kind of problem, particularly when the plugin is promoted as being light. It is however worthwhile noting that the developers do inform you of this issue and recommend cleaning the database regularly; therefore I need to accept responsibility of this issue myself.
This is what the developers of Performance Profiler say about their plugin:
Tools like the xdebug profiler are great, but they add a lot of overhead and are focused on individual requests, and require setup at the server level, which you may not have access to. The uncluttered user face of the WP Performance Profiler, is easily navigable, allowing you to get straight to the root of the problem and detect the plugins that are slowing down your site.
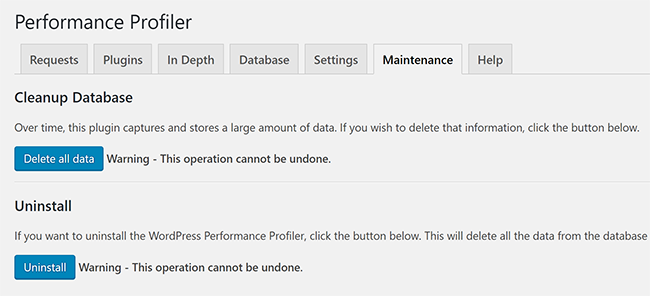
Thankfully, Performance Profiler has a maintenance tool built in that lets you clean up the database and remove all the data. The uninstall plugin will also deactivate and completely delete the plugin from your website. I don’t recommend selecting the uninstall option until you have backed up the plugin.

After cleaning the database, its size dropped from 19.5GB to only 159MB.
It’s quite embarrassing that I let my database grow to such a large size without noticing the problem. It’s a stark reminder of the importance of checking your website regularly.
Final Thoughts
I am glad that I was able to clean up my database and remove so much unnecessary overhead.
This incident was an example of what can happen if you don’t check your WordPress website from time to time to evaluate whether everything is ticking along nicely.
Performance Profiler is a useful plugin that I would still highly recommend to other WordPress users as it can help detect problematic WordPress plugins, but be sure to disable it after using it. If you leave it activated you should make sure you clean the database on a regular basis.
Thanks for reading.
Kevin

